Search results
Search for "thermal excitation" in Full Text gives 23 result(s) in Beilstein Journal of Nanotechnology.
A bifunctional superconducting cell as flux qubit and neuron
Beilstein J. Nanotechnol. 2023, 14, 1116–1126, doi:10.3762/bjnano.14.92

- system. Even in the case of adiabatic control, relaxation and thermal excitation processes can introduce additional difficulties that need to be considered when designing quantum interferometers and tuning circuits, adjusters, and neurons based on them. In particular, dissipative processes significantly


Intermodal coupling spectroscopy of mechanical modes in microcantilevers
Beilstein J. Nanotechnol. 2023, 14, 123–132, doi:10.3762/bjnano.14.13

- applied to the piezoshaker, with the frequency swept close to ωi, used to amplify the spectral response of the sense mode above the thermal excitation level. The above Hamiltonian is a modified version of the one used in [27]. In contrast to this previous work, we do not exclude the possibility of


Comprehensive review on ultrasound-responsive theranostic nanomaterials: mechanisms, structures and medical applications
Beilstein J. Nanotechnol. 2021, 12, 808–862, doi:10.3762/bjnano.12.64


Determining amplitude and tilt of a lateral force microscopy sensor
Beilstein J. Nanotechnol. 2021, 12, 517–524, doi:10.3762/bjnano.12.42

- calibration factor that relates the recorded amplitude signal of the oscillation in volts to the real oscillation amplitude in meters. At room temperature the thermal excitation of the sensor can be used to calibrate the amplitude [18]. For low temperatures, another method has to be used since the thermal


Light–matter interactions in two-dimensional layered WSe2 for gauging evolution of phonon dynamics
Beilstein J. Nanotechnol. 2020, 11, 782–797, doi:10.3762/bjnano.11.63

- found that > τ(A1g) for all temperatures, which is quite similar to what we found in Figure 2d where we showed ≈ 2× τ(A1g) for all P. Specifically, the upper and lower bounds for τ were determined to be 1.42 × τ(A1g) < < 1.90 × τ(A1g) for all T. The decay in τ caused by the thermal excitation energy


Current measurements in the intermittent-contact mode of atomic force microscopy using the Fourier method: a feasibility analysis
Beilstein J. Nanotechnol. 2020, 11, 453–465, doi:10.3762/bjnano.11.37

- current amplifiers to overload and may dominate all other current signals, and this issue would be ever present regardless of the application and regardless of the type of tip used. This might be eliminated through alternate cantilever excitation methods, such as laser-based thermal excitation, although
- existing commercial devices with this type of excitation cannot always provide reliable and sufficiently strong excitation suitable for all types of AFM probes. This has, in fact, been the case when we have attempted to drive solid platinum probes in our laboratory, for which our thermal excitation did not


On the relaxation time of interacting superparamagnetic nanoparticles and implications for magnetic fluid hyperthermia
Beilstein J. Nanotechnol. 2019, 10, 1280–1289, doi:10.3762/bjnano.10.127

- Discussion Relaxation time and interparticle interactions: a critical survey The first expression of the relaxation time of magnetic monodomain particles (of Stoner–Wohlfarth-type) with the thermal excitation energy (kT) approaching the particle anisotropy barrier energy (e.g., ΔE = KV in the case of


Noise in NC-AFM measurements with significant tip–sample interaction
Beilstein J. Nanotechnol. 2016, 7, 1885–1904, doi:10.3762/bjnano.7.181
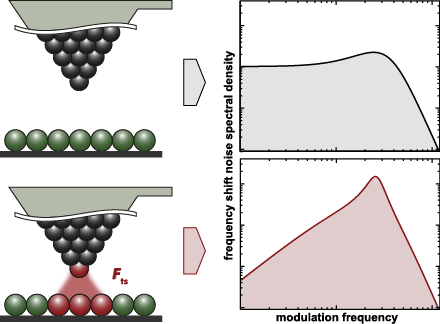
- displacement noise quantities, namely the displacement noise power spectral density of the detection system (frequently referred to as the noise floor) and the thermal noise power spectral density [11]. Note that the latter cantilever thermal excitation noise contribution can be predicted from the oscillator
- of the cantilever excitation signal to the oscillation amplitude at the cantilever resonance if neither amplitude noise nor amplitude disturbances are present, i.e., in absence of tip–sample interactions. The sum of excitation signal noise and thermal excitation noise is band-pass-filtered by the


![[Graphic 32]](/bjnano/content/inline/2190-4286-7-181-i73.png?max-width=637&scale=1.18182) wit...
wit...

![[Graphic 34]](/bjnano/content/inline/2190-4286-7-181-i75.png?max-width=637&scale=1.18182) wit...
wit...


Nonlinear thermoelectric effects in high-field superconductor-ferromagnet tunnel junctions
Beilstein J. Nanotechnol. 2016, 7, 1579–1585, doi:10.3762/bjnano.7.152

- investigate the dependence of thermoelectric currents on the thermal excitation, as well as on the presence of a dc bias voltage across the junction. Conclusion: Large thermoelectric effects are observed in superconductor/ferromagnet and superconductor/normal-metal hybrid structures. The spin-independent
- context the superconductor is kept at zero chemical potential, and both voltage bias V and thermal excitation δT are applied to the normal-metal (or ferromagnet). All currents are counted flowing into the superconductor. We can in general express the charge and heat currents flowing out of the ferromagnet
- find δT ≈ 0.8δTF. Details of the temperature calibration can be found in [17] and Supporting Information File 1. To measure the thermoelectric current through the junction, we apply a low-frequency ac heater current. Since the heating power is proportional to I2, this generates a thermal excitation on


Evidence for non-conservative current-induced forces in the breaking of Au and Pt atomic chains
Beilstein J. Nanotechnol. 2015, 6, 2338–2344, doi:10.3762/bjnano.6.241

- are atomic chains of Au and Pt atoms, for which we investigate the distribution of break down voltage values. We observe two distinct modes of breaking for Au atomic chains. The breaking at high voltage appears to behave as expected for regular break down by thermal excitation due to Joule heating


Calibration of quartz tuning fork spring constants for non-contact atomic force microscopy: direct mechanical measurements and simulations
Beilstein J. Nanotechnol. 2014, 5, 507–516, doi:10.3762/bjnano.5.59

- [15] or static deflection [17][18] of the cantilever. Alternatively, the stiffness can be estimated from thermal excitation [19]. Here we employed a very simple and easily implementable method to measure the stiffness of the tuning fork sensors by only using a micrometer screw and a scale. The setup


Impact of thermal frequency drift on highest precision force microscopy using quartz-based force sensors at low temperatures
Beilstein J. Nanotechnol. 2014, 5, 407–412, doi:10.3762/bjnano.5.48

- determination of nq one can use thermal excitation spectra of the sensors C and Ct at room temperature analogous to previous studies [7][15][30]. For this purpose the sensors C and Ct were put into a metal box for shielding, one of the electrodes was grounded, whereas the second electrode was connected via a
- BNC feedthrough to the charge amplifier [26]. The output signal of the charge amplifier was measured with a spectrum analyzer (Agilent 35670A Dynamical Analyzer). The measured thermal excitation spectra at room temperature are shown in Figure 4. From there, the values of nq for sensors C and Ct are
- ) Numerical derivative ∂kts/∂T for all tuning fork and qPlus sensors from 5–47 K. (b) ∂kts/∂T for LER. Note, the y scale is different for (a) and (b). Thermal excitation spectra for sensors C (a) and Ct (b). The center frequency in (a) is f0 = 32.939 kHz and the frequency range is 400 Hz, in (b) f0 = 73.351


Noise performance of frequency modulation Kelvin force microscopy
Beilstein J. Nanotechnol. 2014, 5, 1–18, doi:10.3762/bjnano.5.1

- and optimizing around randomly chosen key values. Keywords: dynamic; frequency noise; Kelvin force microscopy; noise performance; phase noise; thermal excitation; Introduction Surface potential imaging in combination with atomic force microscopy in ultrahigh vacuum is based on the measurement of
- propagation from sensor displacement noise to the Kelvin voltage output. Giessibl et al. [9] compared qPlus and length-extension resonator (LER) sensors with respect to four noise sources: thermal excitation, sensor displacement noise, oscillator noise and thermal drift noise. The impact of all noise sources
- dominating detector and thermal excitation noise is derived. Noise optimization can then be approached via probe design after identifying the bottlenecks and addressing the respective parameters. The work is an approach toward a more integral view of KFM performance. A limit to optimization is the


Determining cantilever stiffness from thermal noise
Beilstein J. Nanotechnol. 2013, 4, 227–233, doi:10.3762/bjnano.4.23

- thermal excitation, namely the resulting noise power spectral density of the cantilever displacement , is the superposition of contributions from all modes and can be derived within the framework of the Nyquist theory [3]. Provided the simple harmonic oscillator model is valid, i.e., the internal damping
- response (Equation 3 in [12]) yields = 283,620 Hz and = 28,600 in excellent agreement with the thermal noise analysis. Generally, the fit of the thermal noise model from Equation 3 to the measured thermal excitation displacement data is excellent. In terms of experimental uncertainties, the highest
- in the calibration of the additional equipment involved. Note, however, that any noise source besides the thermal excitation yields a reduction in the measured modal stiffness and cannot explain values that are too high. The determination of the effective cantilever stiffness from frequency shift

![[Graphic 34]](/bjnano/content/inline/2190-4286-4-23-i40.png?max-width=637&scale=1.18182) measured for the fundamental mode of cantilever V 4. Measureme...
measured for the fundamental mode of cantilever V 4. Measureme...


![[Graphic 23]](/bjnano/content/inline/2190-4286-4-23-i29.png?max-width=637&scale=1.18182) measured for cantilever V 4 (A0 = 16.8 nm, demodulator band...
measured for cantilever V 4 (A0 = 16.8 nm, demodulator band...
Photoresponse from single upright-standing ZnO nanorods explored by photoconductive AFM
Beilstein J. Nanotechnol. 2013, 4, 208–217, doi:10.3762/bjnano.4.21

- capturing them back at the defect. Both conditions, thermal excitation from the PHS and capture by the DLS, have to be fulfilled simultaneously, which implies slow kinetics for the photocurrent decay. The presence of the PHS state makes a transition from the valence band to the PHS state possible, which


Thermal noise limit for ultra-high vacuum noncontact atomic force microscopy
Beilstein J. Nanotechnol. 2013, 4, 32–44, doi:10.3762/bjnano.4.4

- of Gfilter can be set by the user according to the needs of the experiment. Noise in NC-AFM consists mainly of three contributions: noise arising from the thermal excitation of a cantilever or another force sensor, noise caused by the detection system and signal processing electronics [3][4], and
- cantilever resonance. Especially high Q-factor cantilevers strongly amplify the white spectral power of thermal excitation only in a narrow range of frequencies around f0 according to Equation 2. The detection-system noise represented by is governed by the quality of the optical and electronic components


![[Graphic 53]](/bjnano/content/inline/2190-4286-4-4-i64.png?max-width=637&scale=1.18182) =
= ![[Graphic 32]](/bjnano/content/inline/2190-4286-4-4-i43.png?max-width=637&scale=1.18182) f...
f...


![[Graphic 56]](/bjnano/content/inline/2190-4286-4-4-i67.png?max-width=637&scale=1.18182) using three diff...
using three diff...

Calculation of the effect of tip geometry on noncontact atomic force microscopy using a qPlus sensor
Beilstein J. Nanotechnol. 2013, 4, 10–19, doi:10.3762/bjnano.4.2

- , thermal tuning of qPlus sensors with spring constants on the order of 2 kN·m−1 remains a challenging experimental task as the rms amplitude of thermal excitation at 300 K is ≈1.4 pm. For well-calibrated force measurements, the dynamic spring constant for the excited eigenmode ki must be calculated. By


Characterization of the mechanical properties of qPlus sensors
Beilstein J. Nanotechnol. 2013, 4, 1–9, doi:10.3762/bjnano.4.1

- . The aim of this paper is to compare and critically discuss the following methods for estimating the stiffness of qPlus sensors: (i) the added-mass method; (ii) thermal excitation; and (iii) a method based on the continuum theory of elasticity. In particular we will estimate and compare the stiffness
- and the error arising from the determination of frequencies is negligible, the estimated maximal error of the stiffness from Cleveland’s method is also around 11%. Thermal excitation The harmonic oscillator in equilibrium with its environment fluctuates in response to the thermal noise. The prong of
- stiffness values using the three methods, as can be seen from a direct comparison in Table 4. The variation in the calculated stiffness values stays within the 10% range for both the continuum theory of elasticity and Cleveland’s method; and within 20% range for the thermal-excitation method (see Table 4


Spring constant of a tuning-fork sensor for dynamic force microscopy
Beilstein J. Nanotechnol. 2012, 3, 809–816, doi:10.3762/bjnano.3.90

- tuning fork in qPlus configuration. The simple calculation for a rectangular cantilever is compared to the values obtained by the analysis of the thermal excitation and by the direct mechanical measurement of the force versus displacement. To elucidate the difference, numerical simulations were performed


Wavelet cross-correlation and phase analysis of a free cantilever subjected to band excitation
Beilstein J. Nanotechnol. 2012, 3, 294–300, doi:10.3762/bjnano.3.33

- traditional Fourier spectra. Regarding environmental noise, it has been demonstrated that by using only thermal excitation it is possible to retrieve useful information from force spectroscopy [11] with a single approach curve under standard operating conditions. Regarding the thermal noise, the excitation


A measurement of the hysteresis loop in force-spectroscopy curves using a tuning-fork atomic force microscope
Beilstein J. Nanotechnol. 2012, 3, 207–212, doi:10.3762/bjnano.3.23

- MgO tip and a MgO surface by L. N. Kantorovich and T. Trevethan [6] showed that the width of such a hysteresis, which may be observed experimentally, depends on the temperature. Due to thermal excitation the width reduces to 1 Å at 100 K and to 0.1 Å at room temperature. The development of NC-AFM


Tip-sample interactions on graphite studied using the wavelet transform
Beilstein J. Nanotechnol. 2010, 1, 172–181, doi:10.3762/bjnano.1.21

- oscillations of a cantilever with an interacting tip. This analysis allows to retrieve the force gradients, the forces and the Hamaker constant in a measurement time of less than 40 ms. Keywords: AFM; force; graphite; thermal excitation; wavelet transforms; Introduction The non-contact atomic force
- . As a rule of thumb, CWT should allow to follow more easily the single-thermal-excitation-event time decay in high-Q environments and measure its frequency linewidth in low-Q environments. The first flexural mode frequency shift near the surface (Figure 7b) provides a complete force distance curve
- thermal excitation. Wavelet transform of the cantilever thermal fluctuations around its instantaneous equilibrium position, using three mother wavelet with different shaping factor, a) GS=12, b) GS=35, c) GS=53. Increasing the shaping factor improves the frequency resolution but lowers the time resolution


Preparation and characterization of supported magnetic nanoparticles prepared by reverse micelles
Beilstein J. Nanotechnol. 2010, 1, 24–47, doi:10.3762/bjnano.1.5

- be below this Stoner–Wohlfarth limit. This deviation can be understood within the framework of thermal excitation as previously shown [76]. From a qualitative standpoint, the thermal energy gives rise to a reduced switching field of NPs and thus a steeper slope of the DCD and a lowered increase in


